The growth of internet users has brought about social and economic benefits on a global scale. However, significant harms such as online violence, disinformation, and hate speech have also proliferated in these online spaces. Discriminatory gendered practices are shaped by social, economic, cultural, and political structures in the physical world and are similarly reproduced online across digital platforms. Uganda, too, has experienced rising rates of online harassment targeting both women in public life as well as everyday users.
Online violence manifests during periods of political activity, and, when directed at women in public life and political discourse, is an example of Violence Against Women in Politics (VAW-P) (NDI, 2019). It is, therefore, referred to as Online Violence Against Women in Politics (OVAW-P). In order to understand how this report sought to identify and analyze the scale of online violence targeted at women political candidates and high-profile individuals during the January 2021 General Election in Uganda. The report also sought to determine how this online harassment might impact their use of social media platforms for political activity during the elections.
For this purpose, we identified and monitored the accounts of 152 nominated candidates and 50 high-profile individuals during the campaign and election period on the two most widely used public platforms, Facebook and Twitter. Methodologies used include lexicon building focus group discussions, data scraping of publicly available profiles, qualitative data analysis, and development of a Machine Learning (ML) model to identify and tag instances of OVAWP in both English and Luganda.
How did women politicians in Uganda use social media platforms for campaigning during scientific general elections?
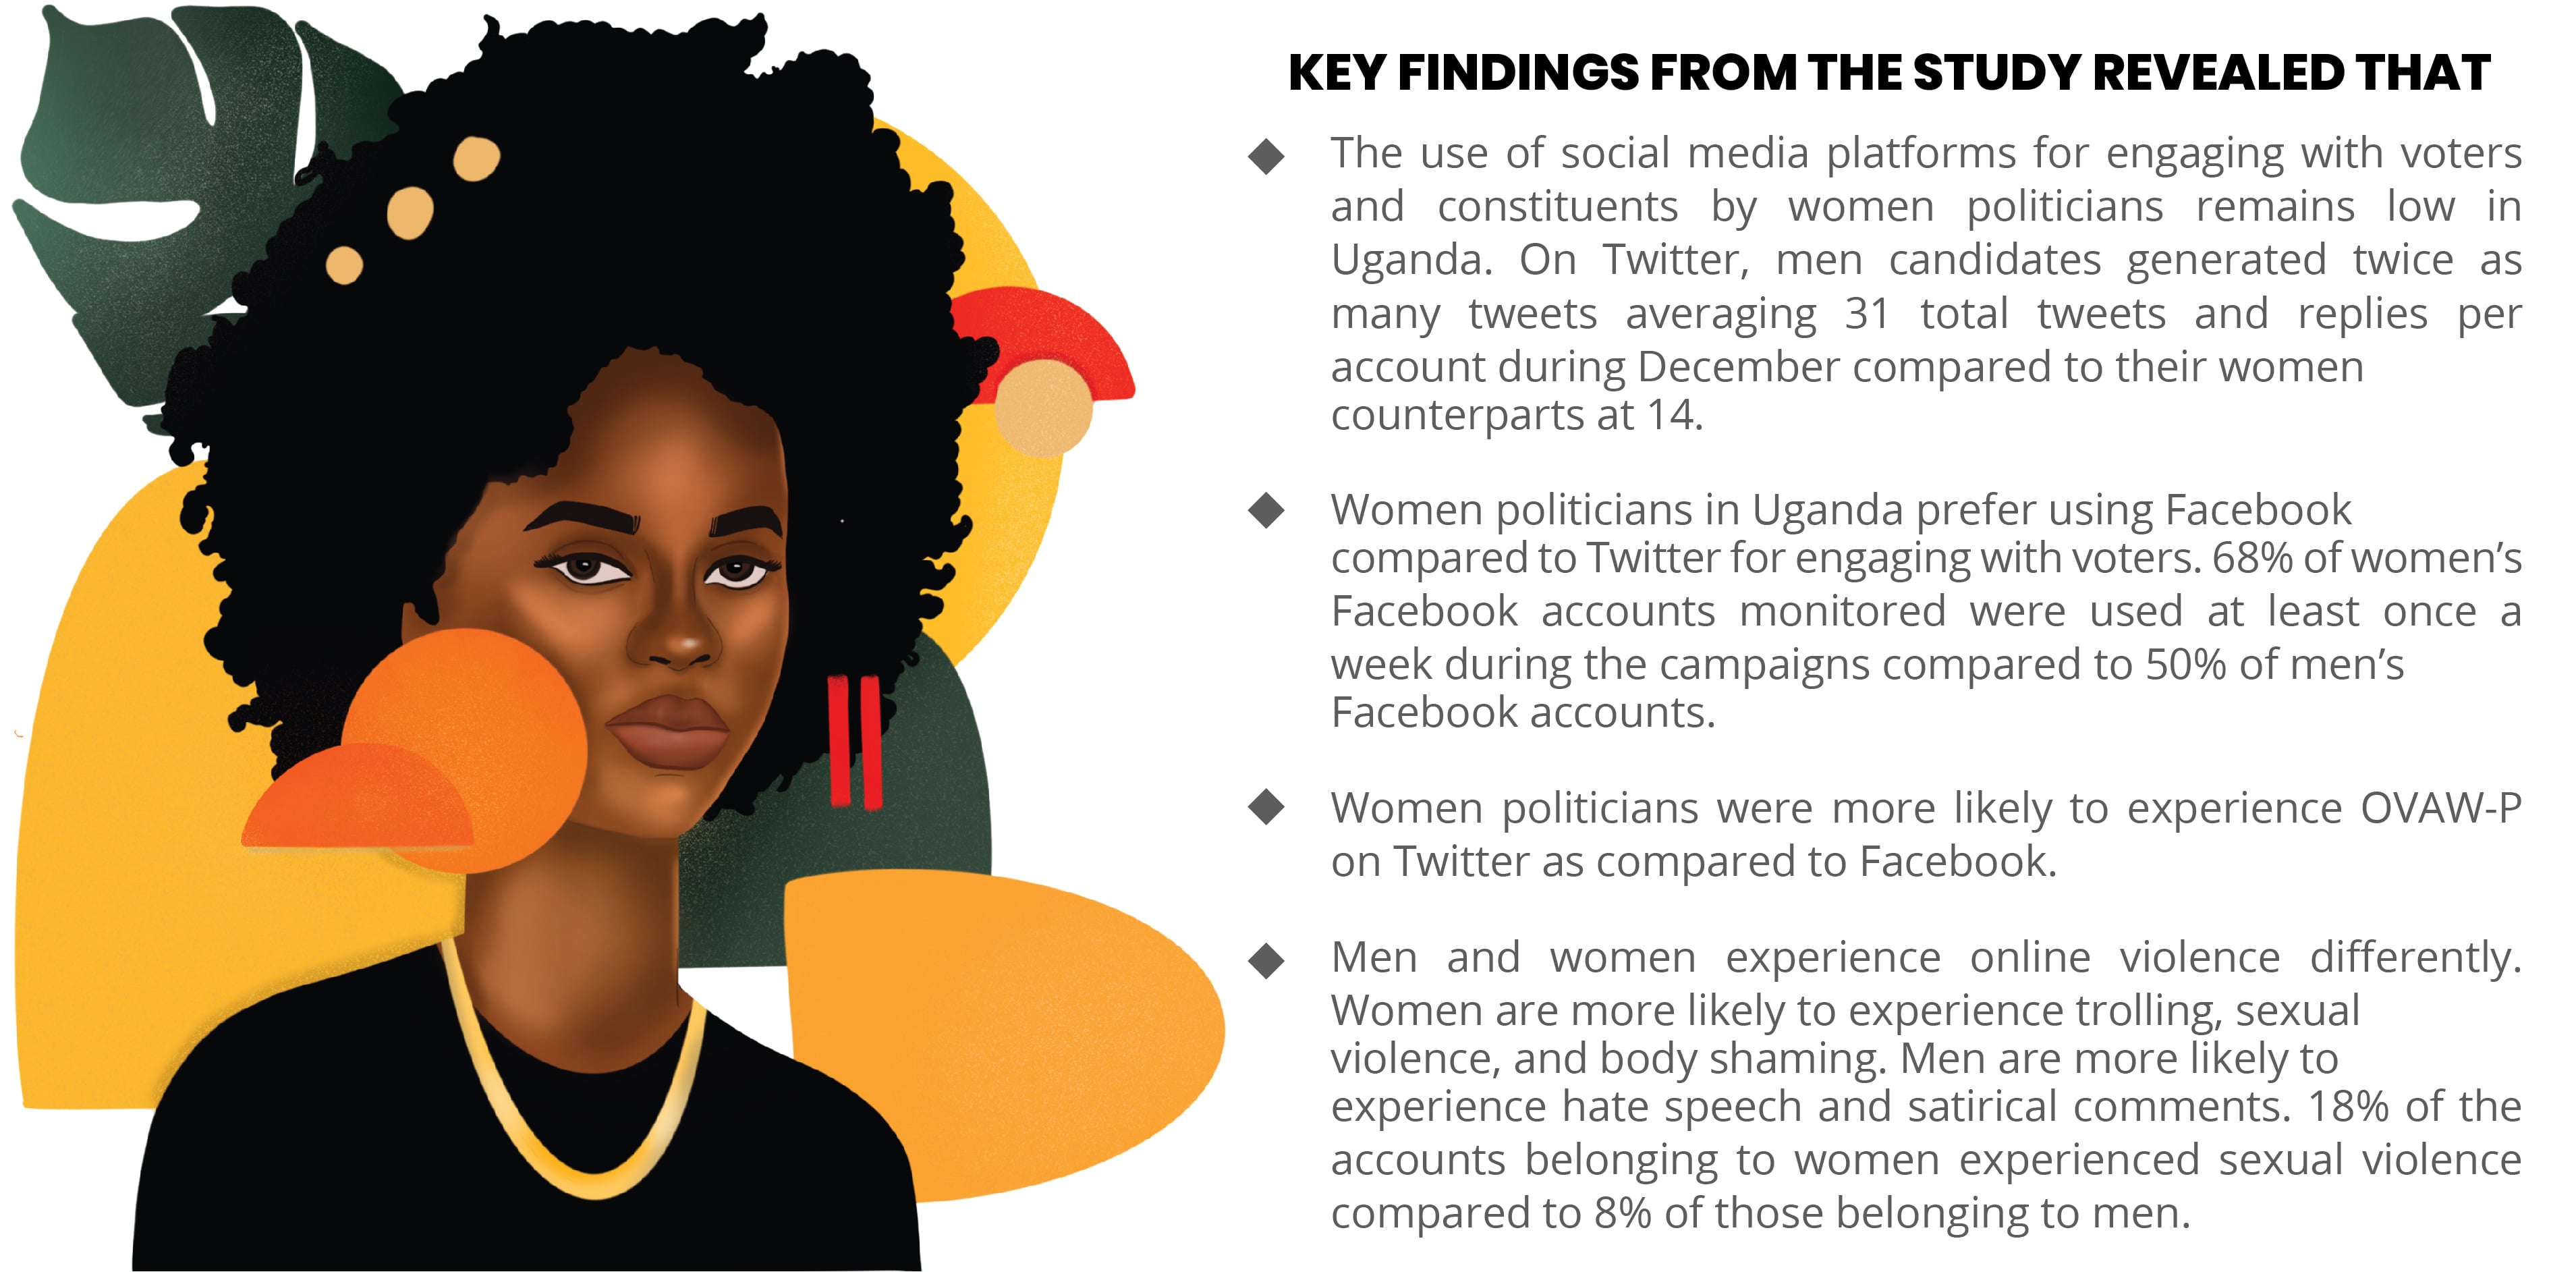
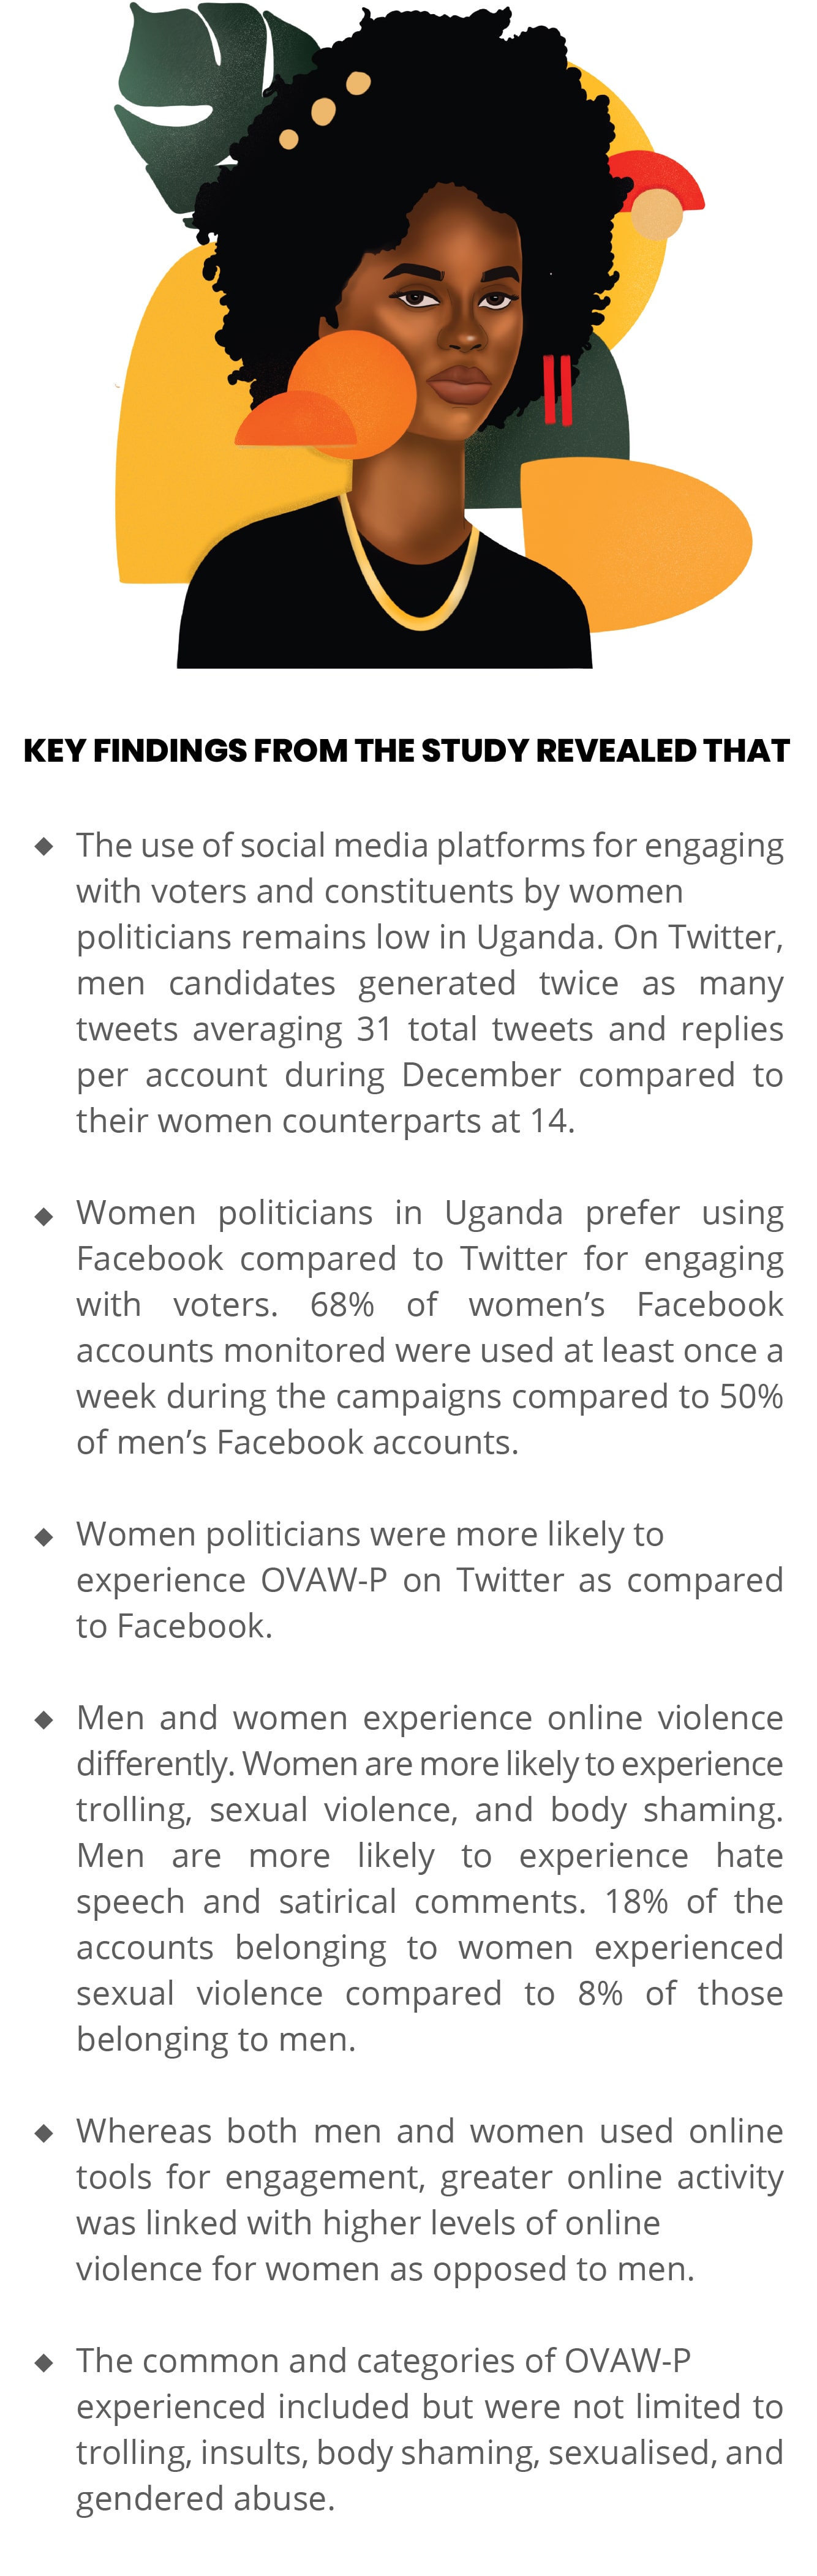
Our study found that nine out of every ten (89%) accounts were used to put out at least one tweet/post during the campaign period. Twitter was the most widely used platform with 92% of the candidates using the platform at least once during the monitoring period while Facebook had 86%. There was a considerable drop in social media usage during the month of January, which is greatly attributable to the internet shutdown in Uganda. In terms of gender, women were most active on Facebook while men dominated usage on Twitter. At least 69% of the accounts belonging to female candidates on Facebook were used at least once each week compared to the men at 47.5%.
What sentiments are attached to women's social media posts and how are these sentiments distributed?
Using sentiment analysis, the sentiment of the comments and replies from social media users to the candidates was analysed. According to the data, higher engagement by a candidate group leads to a higher volume of negative comments across both platforms. On Facebook, women candidates received 77% of negative comments while on Twitter, men candidates received 85.7% of negative replies.
Is there evidence of OVAW-P? If yes, what are the manifestations of OVAW-P?
Women candidates were more likely to experience trolling, sexual violence and body shaming compared to their male counterparts. Men candidates were more likely to experience hate speech and satirical speech as compared to women candidates. This trend was similarly observed across both social media platforms monitored. However, overall, across almost all categories, violence experienced by both women and men candidates on Twitter was higher than that on Facebook.
Does OVAW-P correlate with other factors such as age, party affiliation, election result, and frequency of social media use?
According to the data, online violence seemed to increase with an increase in age. Older woman candidates were more likely to experience trolling, insults, hate speech, body shaming, sexualised comments, and satirical content.
Are there noticeable links between the perpetrators and their victims?
Using network analysis, the accounts posting comments or replies to each gender were mapped out. The diagram shows that a higher number of unique accounts left comments or replies to men candidates (left cluster), compared to women candidates (right cluster). Fewer numbers of unique accounts posted comments or replies to men and women candidates (middle cluster). This could indicate that certain accounts target women specifically
Note:
As part of this project, a text classification model was used to classify tweets/posts in various categories such as Trolling, Sexual violence, Inuslts, etc. This model can be testedout here!